Data Blending
Say goodbye to Excel downloads
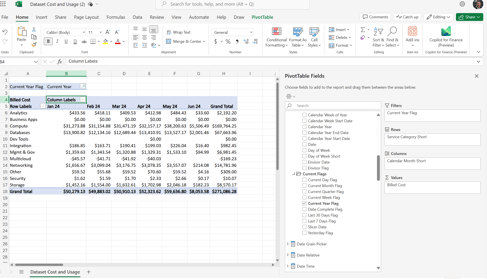
Most FinOps tools, including Envisor, let you export data to Excel for blending and ad hoc analysis. That works fine for one-off tasks. But it breaks down when you need to download more data fields. Or those spreadsheets become daily, weekly, or monthly routines. Manual exports introduce inefficiencies, version control issues, and data staleness.
What you need is continuous data refresh.

Say hello to Envisor live connect to Excel
.png?width=800&height=1200&name=Envisor%20workflow%203%20(3).png)
Envisor enables a live connection between Excel and its data model. Analysts can build reports in Excel that automatically update with the latest Envisor data on open—no scripting, no manual refresh, no re-downloads. You get:
- Direct Excel connectivity to Envisor’s governed data model.
- Auto-refreshing workbooks aligned with your latest data refresh.
- Support for custom KPIs and metrics, built once and reused across Excel and Fabric/ Power BI.
- Easy sharing of reports across teams, with consistent logic and definitions.
Whether you’re working with spreadsheets, cloud data lakes, or enterprise data platforms, Envisor provides a scalable, no-code way to operationalize reporting while reducing manual steps and errors.
Build Fabric/Power BI composite models
Securely blend Envisor FinOps data with other enterprise data sources in your cloud. Maintain sovereignty over sensitive enterprise data.
- Easily build reports incorporating data from multiple sources.
- Create custom metrics and solve use cases such as unit economics and enterprise KPIs.
- Shared reports inherit your corporate security policies.

.png?width=487&height=487&name=Envisor%20Reports%20in%20MS%20Office%20(1).png)
Align Reports Across
Office 365
Drop Power BI or Excel reports into Word or PowerPoint—where they'll always reflect the latest data.
-
Skip the screenshots. Visuals update data automatically.
-
Stay in sync. Everyone sees the same numbers—no version mismatches.
-
Tell a better story. Share insights in the format your audience knows best, with the full power of Word and PowerPoint to add context and clarity.
Supports Analyze in Excel
Rapidly create ad hoc reports that stand the test of time.
- Fastest method for non-Fabric/Power BI users to create custom analyses.
- Great for prototyping Fabric/ Power BI reports.
- Shared reports inherit your corporate security policies.

Supported platforms


