 The agility to Run. Out of the box.
Drive change with reports tailored to your personas
Centralized FinOps teams, you are the quarterbacks of cloud optimization. As you approach Run, your field of visibility needs to expand. Decisions need to be made faster and smarter. Reporting needs to shift to storytelling that is dynamic, cross-departmental and resonant with your personas. AI capabilities are available and ready to help now.
Rigid SaaS-based CCMs do not have the agility to let you quarterback at Run. And you will spend months building a custom solution from scratch.
Envisor combines the convenience of SaaS with the power of a DIY solution.
Fast. Flexible. FinOps.
Answer questions 10x faster. Quickly drill down on almost any metric for details. Because Envisor reports are built and delivered using Power BI, you quickly get answers to questions that would take 10 static reports using typical SaaS-based CCMs.
Cross filter. Simply select a specific element on a page to see all relevant metrics displayed in context. You’ll never get that out of your SaaS CCM!
See the what, drill through to the why. Envisor gives you drill-through capabilities and levels of detail only possible with a DIY built on a data lake or data warehouse. Understand the “why” behind an optimization recommendation for a specific resource.
Get granular. View hourly cost and observability data.
FinOps your way. Easily finesse Envisor to be exactly the CCM solution you want and need. Its extensible platform lets you blend in external data sources and integrate with existing systems, such as enterprise planning.
Comprehensive suite of customizable reports. Covering all FinOps capabilities, Envisor reports can be used out of-the-box or easily customized. A skilled Power BI user can quickly refactor the visualizations to resonate with your personas and corporate culture and enable dynamic storytelling.
FOCUS-compliant cloud data. Envisor's data model terminology is consistent with the FOCUS spec. If you know FOCUS, you know Envisor.
Capabilities
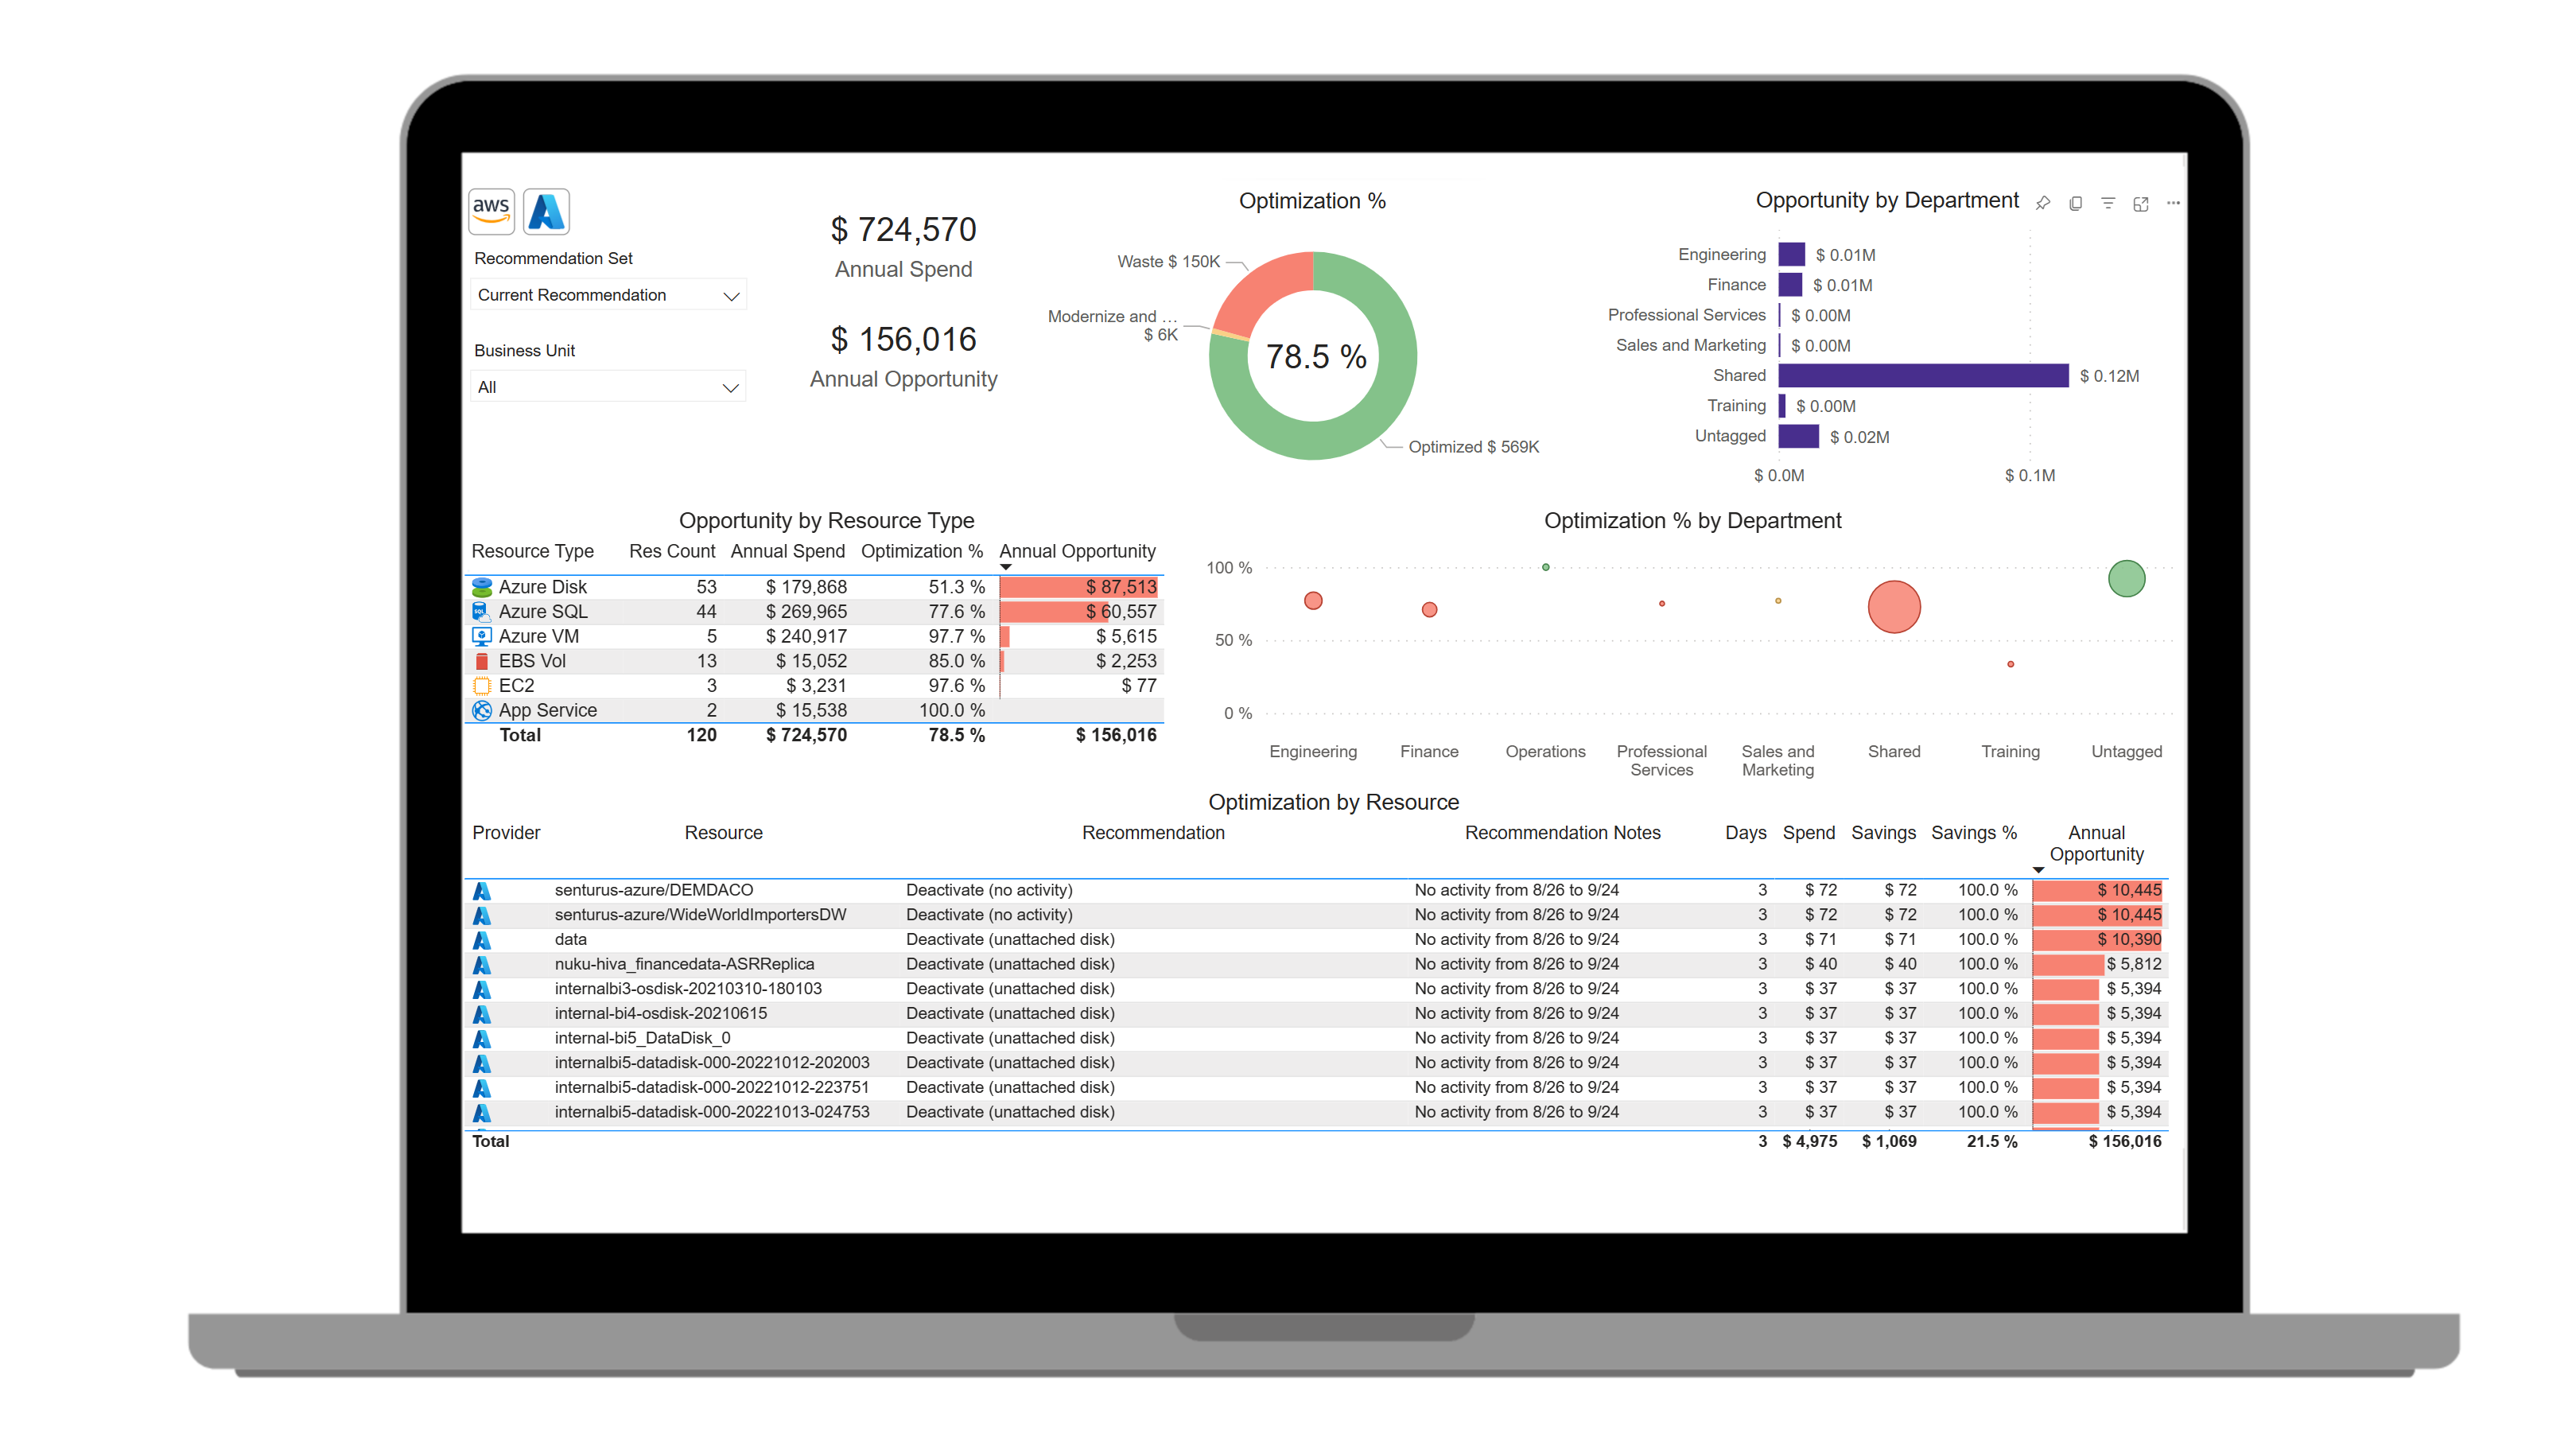
Hourly Cost & Observability Data and Recommendations
Get the most accurate insights and recommendations in the industry
- Provides common FinOps KPIs such as Efficiency Score and Effective Savings Rate.
- Gives recommendations at the department- or resource-type level (or any other dimension such as a cost center).
- Drill down or drill through metrics to get answers faster and increase productivity.
- Lets you view data with hourly granularity.
- Is built on a FOCUS-compliant semantic model that is enriched with data from 80+ APIs.
- Uses a Power BI interface for ease of customization and robust security.

Assess the overall health of your multi-cloud environment
Start your day with an overview that lets you quickly know the current status of your cloud.
- View budget-to-actuals, track your optimization score, and see prioritized opportunities by resource type.
- View Commitment Discount Effective Savings Rate, under-utilized Commitment Discounts, and coverage rates.
- Drill through to individual resource details to analyze potential issues before they become big problems.
Manage to your cloud budget and forecast
Track multi-dimensional cloud budgets and forecast costs by day.
- Define budgets and forecasts using dimensions such as application, cost center, department, etc.
- Set alerts prior to budget/forecast misses.
- Report on budget vs forecast vs actual variances and drill through to identify root cause.
.png?width=486&height=273&name=image%20(7).png)
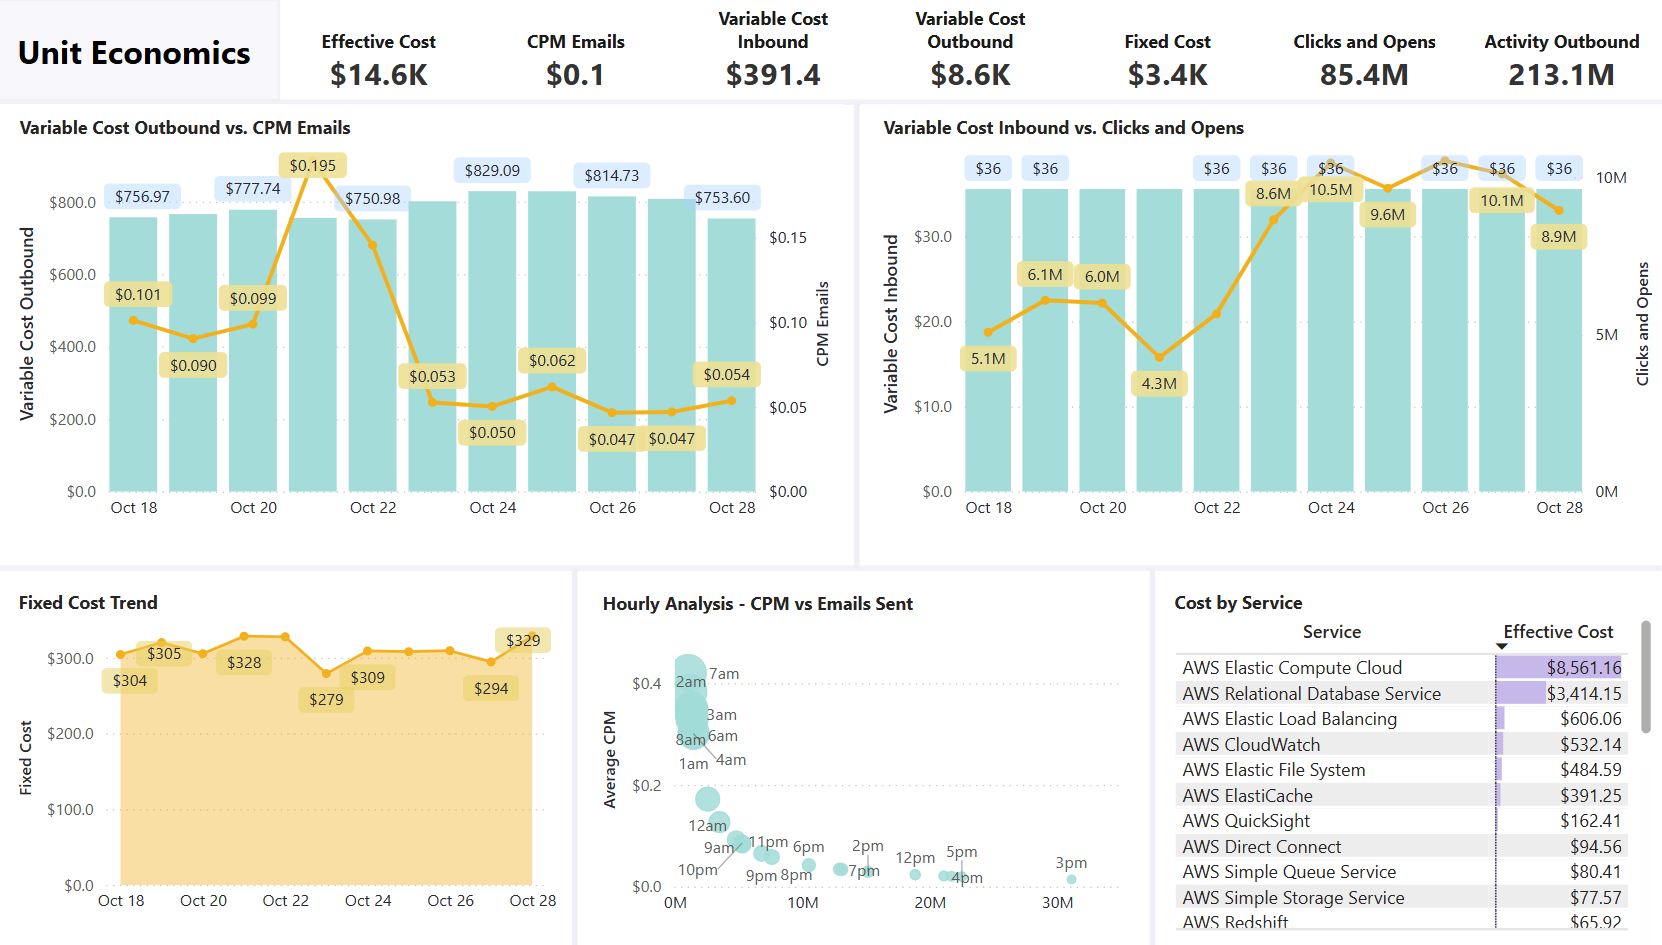
Manage cloud spend with Unit Economics
Understand cloud costs using the only metric that scales with your business drivers.
- Keep your sensitive data within your cloud.
- Blend transactional data such as sales data, units processed, orders fulfilled, etc. to distill unit and value stream costs.
- Pinpoint architectural issues by separating out semi-fixed costs from variable costs.
- Envisor is the only solution that does not require transferring sensitive data outside your environment.
Quickly assess team performance
Use the Optimization Score to understand how teams are performing.
- Provides a common benchmark across departments regardless of resource mix, cloud spend, cloud service provider, etc.
- Defined as 1 minus potential savings/actual spend. Potential savings are identified by Envisor's recommendation engine.
- Excludes resources tagged "informed ignore."

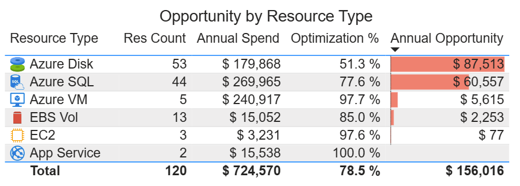
Surface and prioritize opportunities
Focus optimization efforts on opportunities with the biggest payback.
- View cloud spend by resource type and opportunity.
- Select a resource type to cross-filter the entire page.
- Excludes resources tagged "informed ignore."
Get hyper-detailed Commitment Discount recommendations
Go beyond the what. Get to the why.
- See specific recommendations with expected savings, coverage, utilization and waste.
- Understand why a given recommendation is the best option. Envisor analyzes multiple CD scenarios and provides a recommendation as well as topline (100% coverage) and waterline calculations.
- Configure Envisor to show only your organization's CD purchase policies, such as 1- or 3-year terms and preferred payment terms.
.png?width=487&height=271&name=image%20(6).png)
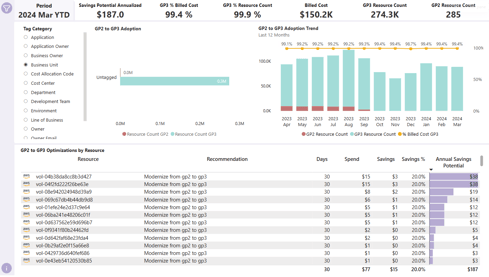
Identify and drive strategic upgrades
Use Envisor's flexible Modernization Scorecards to identify upgrade opportunities and adoption progress.
- Manage modernization of technologies such as Graviton and GP2 to GP3 upgrades.
- View progress and opportunities by tagging; drill into specific departments.
- Prioritize upgrades based on the largest potential savings.
Quickly drill into variances to find root cause
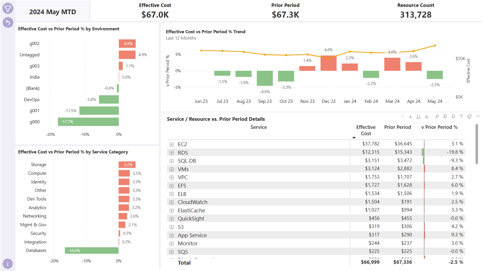
Envisor's Variance Report helps to spot both positive and negative changes.
- Drill down to the resource level to quickly understand root cause of a change in spend.
- Analyze by tags, such as cost center, product, application or engineering team.
- Filter by cloud provider, subaccount or region to analyze trends.
Supported platforms


