Skip to content

Mod report cropped - GP3 AdoptionThe art of balancing  performance and cost 


Empower your engineers to take action

How do you evaluate your FinOps performance? Are you struggling to empower your engineers to take action? Do your engineering leaders have access to FinOps scorecards that are updated daily?                        

Forget answering these questions with a SaaS-based CCM. Or spending months building a custom solution from scratch. 

Envisor combines the convenience of SaaS with the power of a DIY solution.

Fast. Flexible. FinOps.

 Answer questions 10x faster. Quickly drill down on almost any metric for details. Because Envisor reports are built and delivered using Power BI, you quickly get answers to questions that would take 10 static reports using typical SaaS-based CCMs. 

 Cross filter. Simply select a specific element on a page to see all relevant metrics displayed in context. You’ll never get that out of your SaaS CCM!

 See the what, drill through to the why. Envisor gives you drill through capabilities and levels of detail only possible with a DIY built on a data lake or data warehouse. Understand the “why” behind an optimization recommendation for a specific resource.

 Get granular. View hourly cost and observability data.

 FinOps your way. Easily finesse Envisor to be exactly the CCM solution you want and need. Its extensible platform lets you blend in external data sources and integrate with existing systems, such as enterprise planning. 

 Comprehensive suite of customizable reports. Covering all FinOps capabilities, Envisor reports can be used out of-the-box or easily customized. A skilled Power BI user can quickly refactor the visualizations to resonate with your personas and corporate culture and enable dynamic storytelling.

 FOCUS-compliant cloud data. Envisor's data model terminology is consistent with the FOCUS spec. If you know FOCUS, you know Envisor.  

Capabilities

Scorecard displayed on Mac Pro

Hourly Cost & Observability Data and Recommendations

Get the most accurate insights and recommendations in the industry
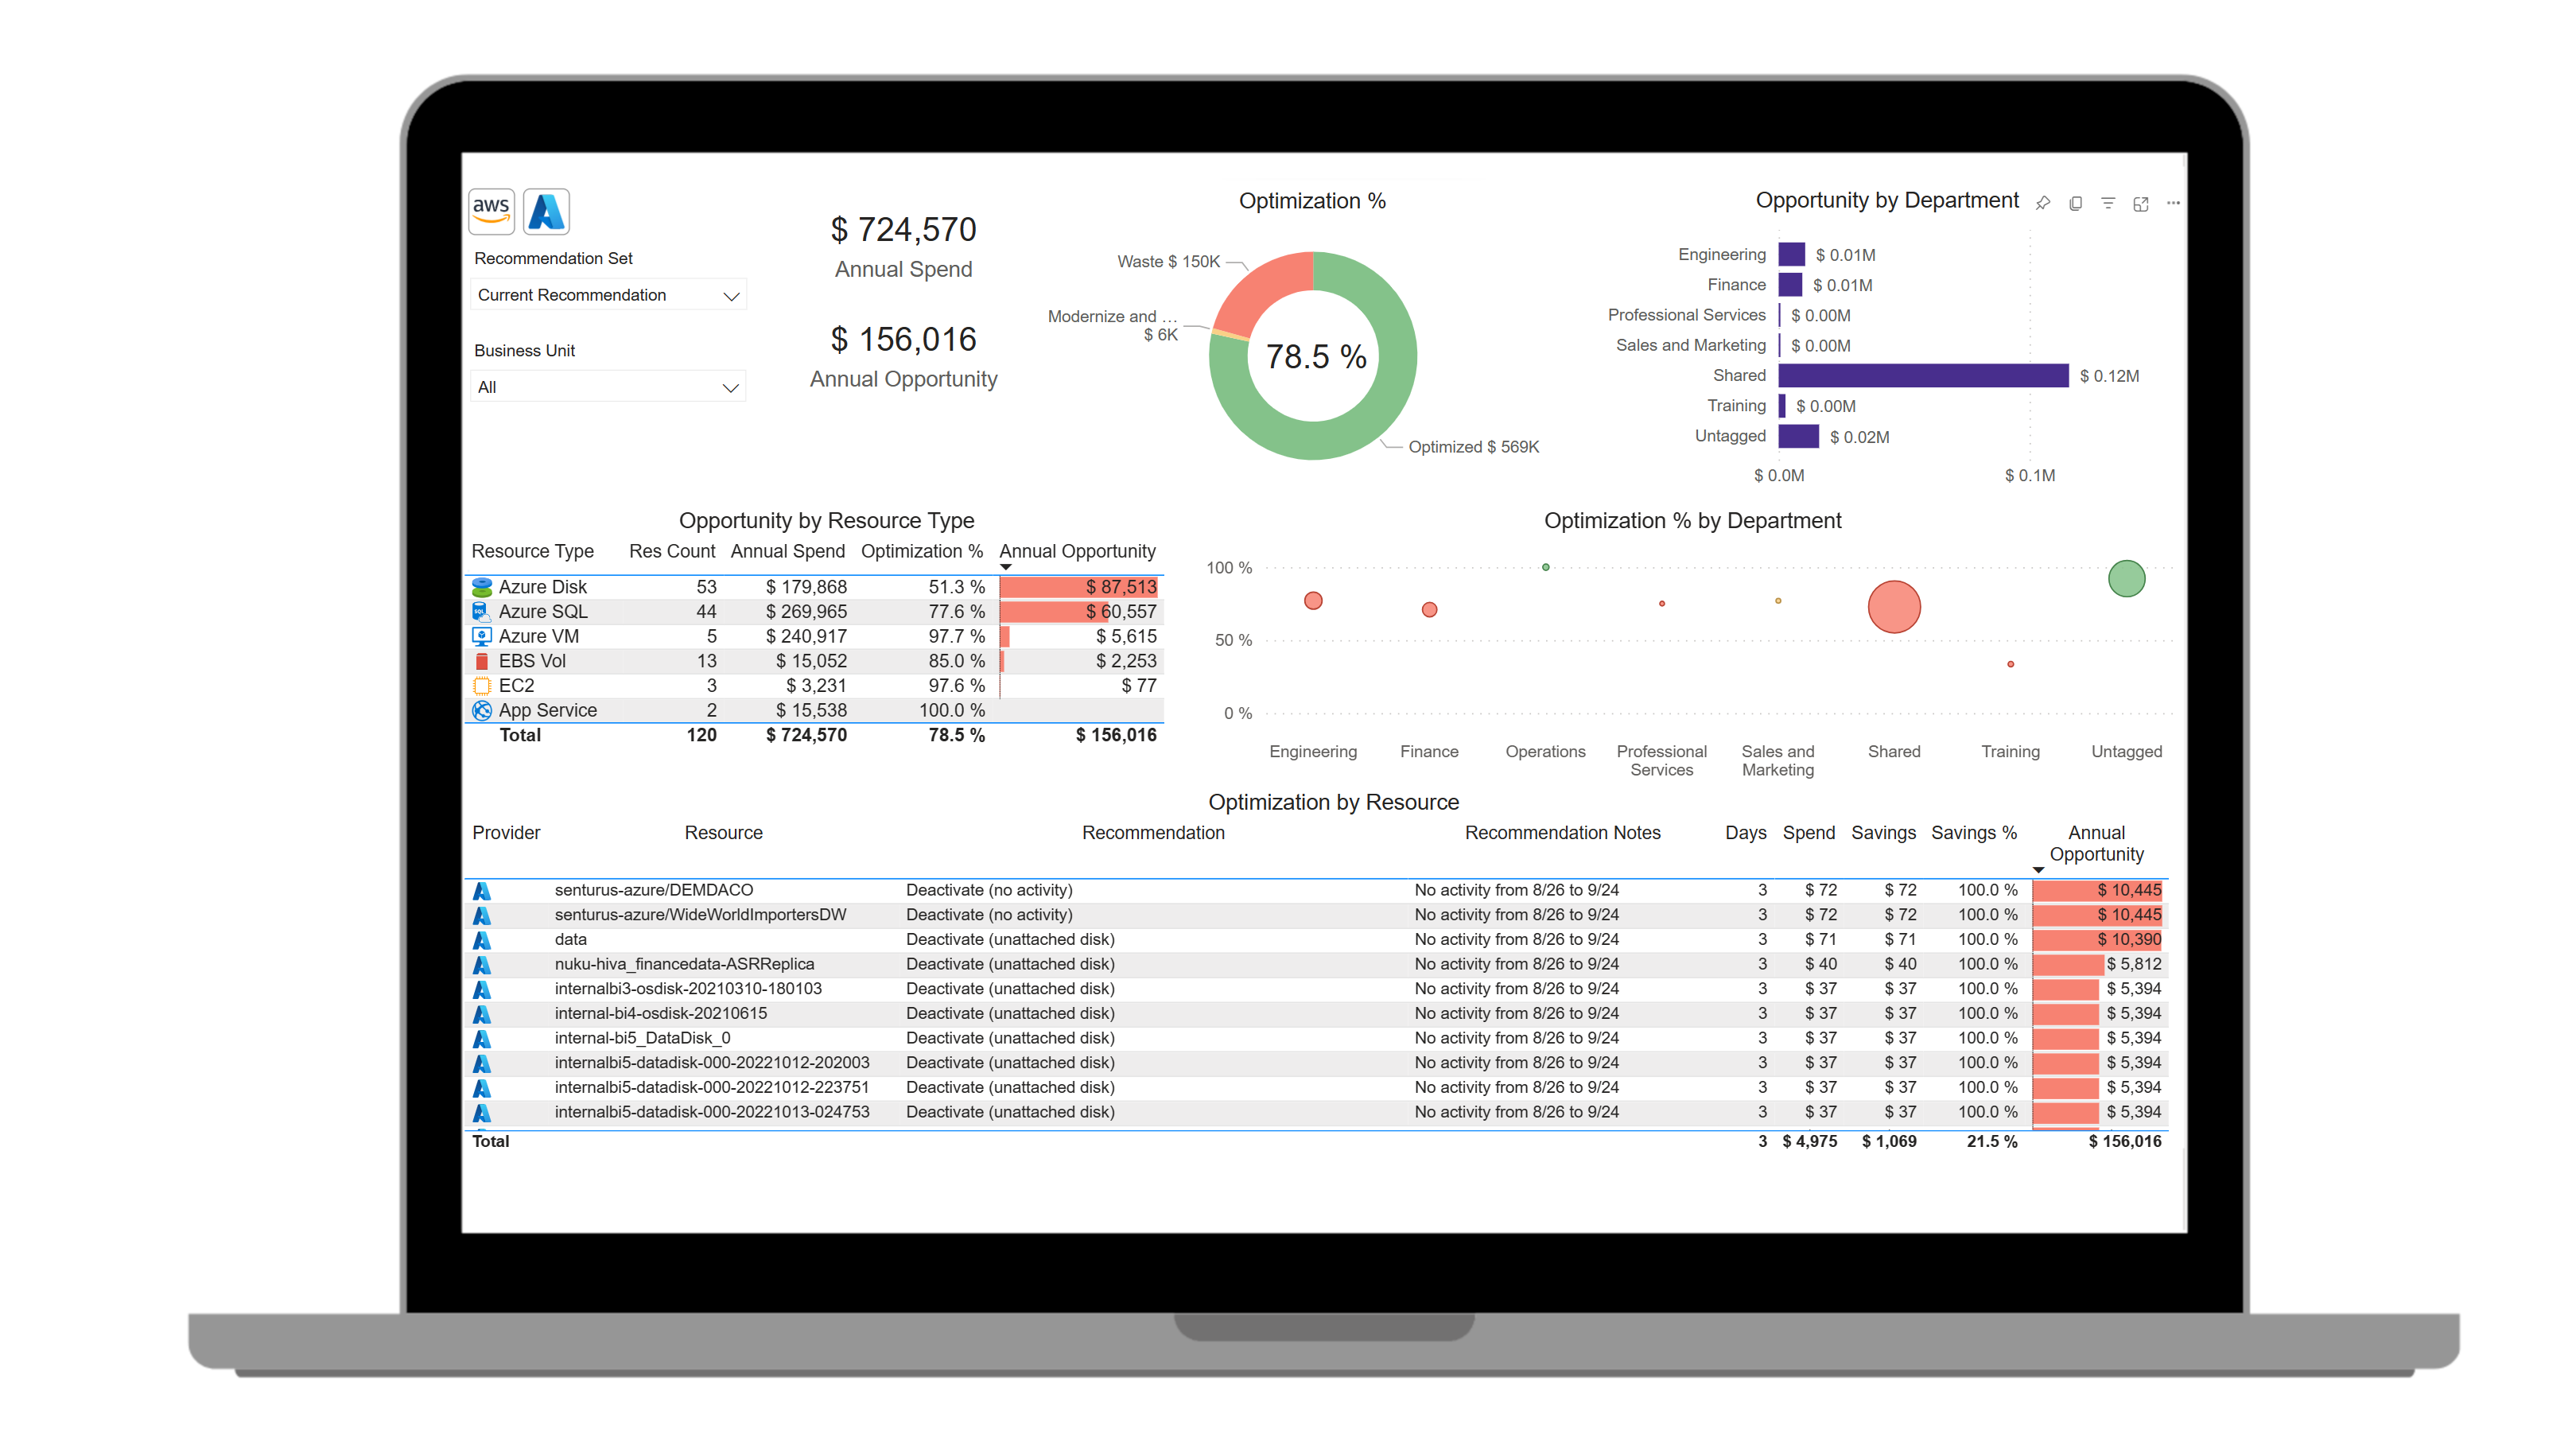
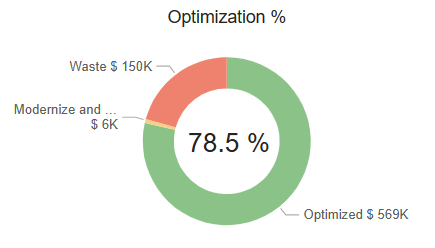
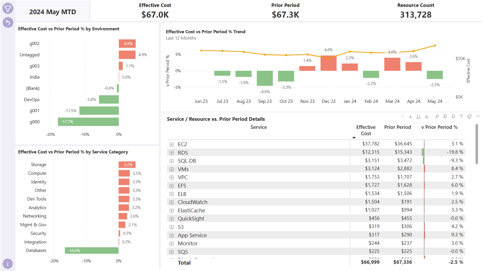
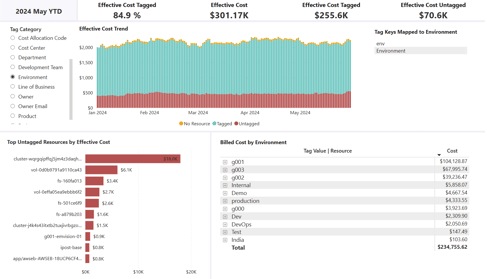
  • Provides common FinOps KPIs such as Efficiency Score and Effective Savings Rate.
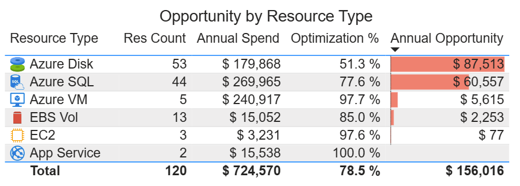
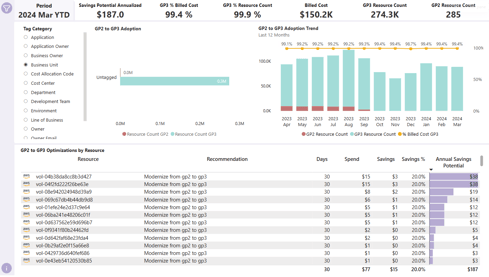
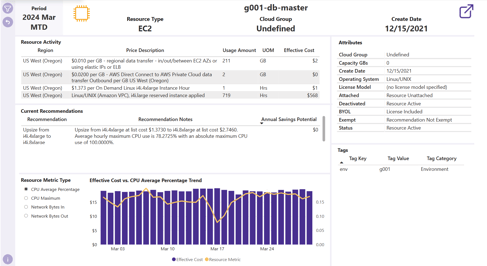
  • Gives recommendations at the department- or resource-type level (or any other dimension such as a cost center).
  • Drill down or drill through metrics to get answers faster and increase productivity.
  • Lets you view data with hourly granularity.
  • Is built on a FOCUS-compliant semantic model that is enriched with data from 80+ APIs.
  • Uses a Power BI interface for ease of customization and robust security.

Quickly assess team performance

Use the Optimization Score to understand how your team is performing.

  • Provides a common benchmark across departments regardless of resource mix, cloud spend, cloud service provider, etc. 
  • Defined as 1 minus potential savings/actual spend. Potential savings are identified by Envisor's recommendation engine.
  • Excludes resources tagged "informed ignore."

Screenshot 2023-12-06 211105


Screenshot 2023-12-12 123839


Surface and prioritize opportunities

Focus optimization efforts on opportunities with the biggest payback.

  • View cloud spend by resource type and opportunity.
  • Select a resource type to cross-filter the entire page.
  • Excludes resources tagged "informed ignore." 

Drive strategic upgrades

Modernization Scorecards let you identify upgrade opportunities and adoption progress.

  • Manage modernization of technologies such as Graviton and GP2 to GP3 upgrades.
  • View progress and opportunities by tags; drill into specific departments.
  • Prioritize upgrades based on the largest potential savings. 
Screenshot 2024-05-08 104126


Screenshot 2024-06-16 153926


Quickly drill into variances to find root cause

Envisor's Variance Report helps you spot both positive and negative changes.

  • Drill down to the resource level to quickly understand root cause of a change in spend.
  • Analyze by tags such as cost center, product, application or engineering team.
  • Filter by cloud provider, subaccount or region to analyze trends.

Drill into resource details from almost any visualization

Access individual cloud resource details.

  • See what's changed over time for an individual cloud resource including sizing and cost history.
  • View resource recommendation.
  • Analyze key observability metrics to validate rightsizing reccomendations.
Screenshot 2024-05-10 164547


Screenshot 2024-06-17 212947


Manage tagging compliance 

Envisor's tagging governance report identifies untagged resources and trends.

  • View tagging compliance by tag categories such as cost center, product, application, etc.
  • See tagging trends over time. 
  • Filter by cloud provider, subaccount or region to analyze trends.
Marco Marini Image & Logo

"Cloud monitoring and optimization that is next level."

Marco Marini, COO, iPost

Supported platforms 

Azure Logo

Google-Cloud-logo