Skip to content

See everything. Start anywhere.
Drill into what matters.

Envisor launchpad view into multi-cloud

Cloud health clarity starts here

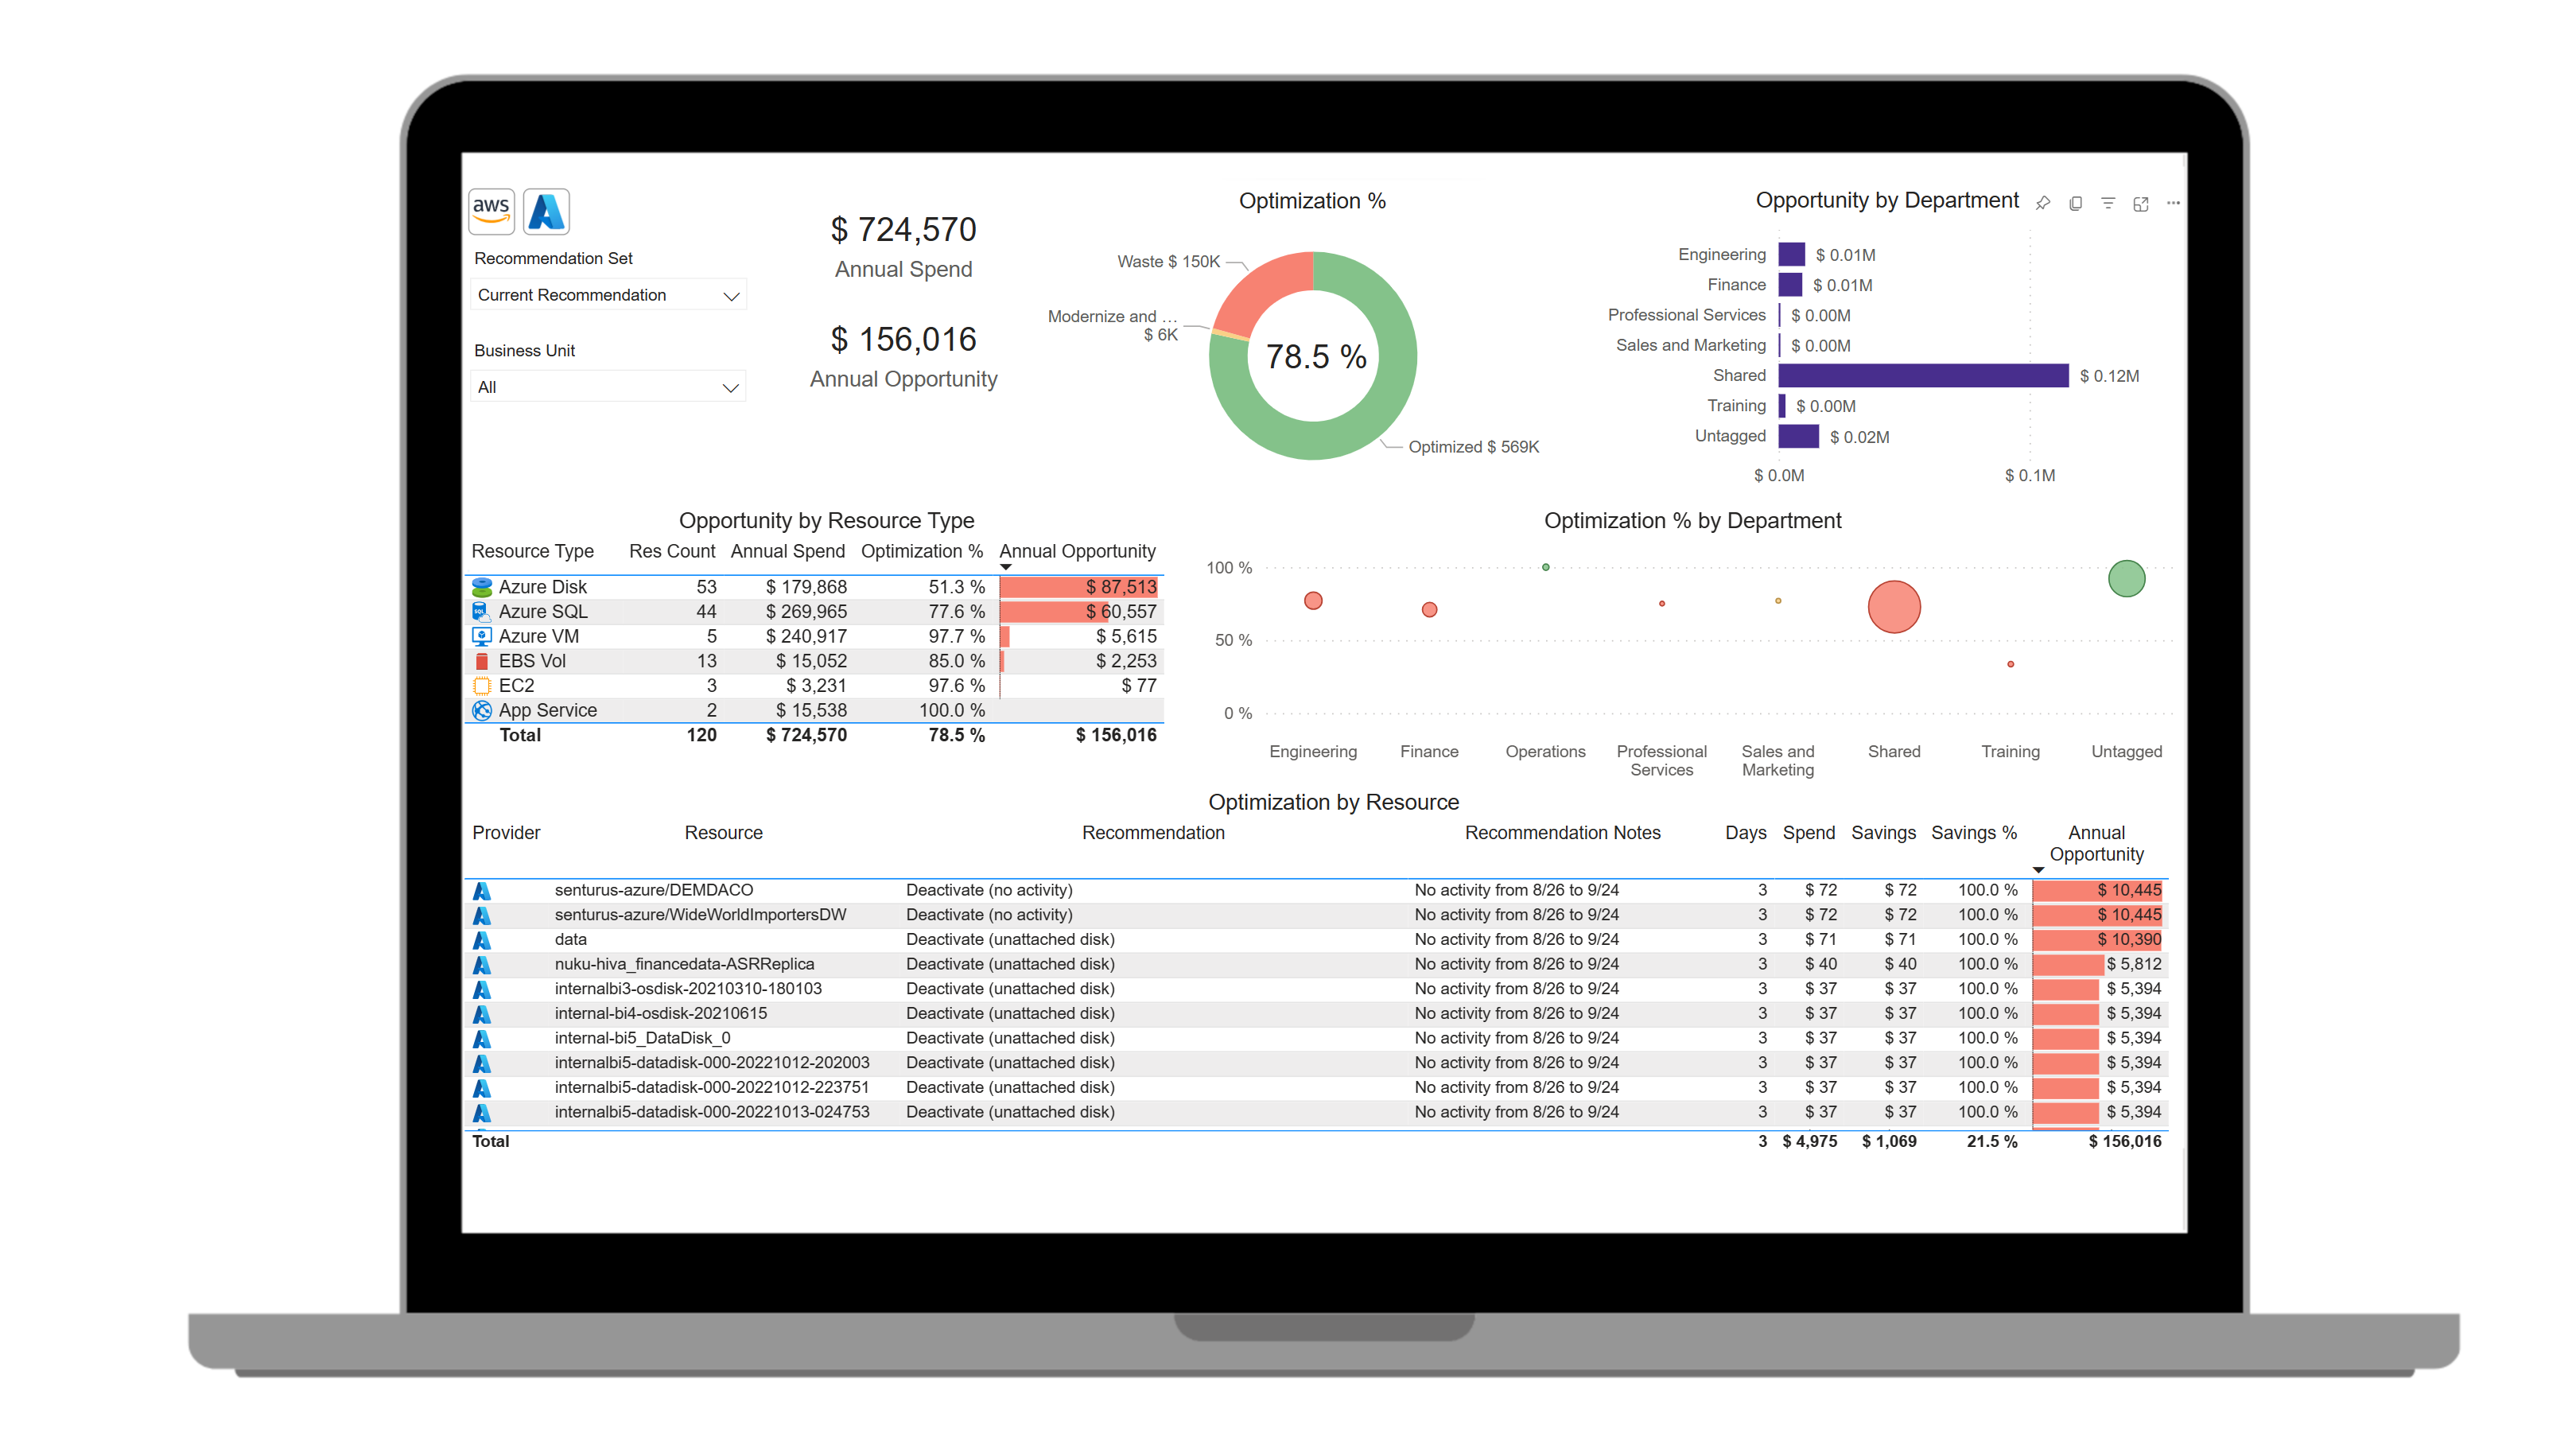
The Envisor Launchpad is your daily command center for managing multi-cloud operations. Organized around key FinOps priorities, it shows real-time cloud status at a glance. One click lets you dive deeper into details.

  • CIOs and leadership, quickly assess overall cloud health or risk.
  • Finance, Engineering and FinOps teams, drill-through to details to analyze potential issues before they become big problems.

Cost visibility

Get different lenses into what it costs to run your cloud.

  • Review historical spend trends.
  • Compare budget-to-actuals.
  • Break down spend by category, e.g., compute, storage, networking.
  • Identify spend by environment or products.
  • View by effective or built cost.
  • Run prior-period comparisons.
Effective cost visibility
Optimization Score

Optimizations

Instantly identify where to focus cost-saving and rightsizing efforts—no spreadsheets, no guesswork.

  • Quickly pinpoint areas of waste and inefficiency.
  • Track your optimization score over time.
  • View prioritized savings opportunities by resource type.
  • See how departments stack up and which has the most area for improvement.
  • Access recommendations across multiple cloud providers and departments.

Commitment discounts

Be confident you're getting the most from your cloud providers’ savings programs.

  • Get detailed analysis; know if you are maximizing your Savings Plans and Reserved Instances utilization.
  • View key metrics for commitment discounts such as Effective Savings Rate, Underutilization, and Coverage Rates.
  • Access detailed, data-backed recommendations for optimal commitment purchases.
  • Easily present insights to management using clear, actionable visuals.
  • Move past vague, black-box suggestions. Make informed decisions. Envisor runs and shows the Monte Carlo simulations behind its recommendations.
Commitment Discount Effective Savings Rate (ESR)
Screenshot 2025-05-28 220924

Cost Allocation

Promote cost accountability and track against multiple dimensions.

  • Perform chargeback and financial system integration.
  • Drive accountability to the edges of your organization.
  • Leverage tags to associate usage/cost to individual business units. 
  • Integrate cloud data into your internal reporting systems and financial management tools. 

Rich, drillable reports.
Built for FinOps, customizable for you.


Department scorecards

Instantly track and elevate FinOps performance across all your teams


  • Easily create tailored scorecards for each team, with customizable visuals, layouts and metrics.
  • View your team’s specific cloud optimization score plus a targeted list of recommendations to help them focus their efforts.
  • Give Engineering leaders a consolidated view of all team scorecards for a clear picture of organization-wide performance.


  • Track multi-dimensional cloud budgets; forecast costs by day.
  • Define budgets and forecasts using dimensions such as application, cost center, department.
  • Set alerts prior to budget/forecast misses.
  • Report on budget vs forecast vs actual variances;  drill through to identify root cause.


Planned vs Actuals

Manage to your cloud budget and forecast with confidence


Cost Variances

Quickly drill into variances to find root cause


  • Drill down to the resource level to quickly understand root cause of a change in spend.
  • Analyze by tags, such as cost center, product, application or engineering team.
  • Filter by cloud provider, subaccount or region to analyze trends.
  • Spot both positive and negative changes.


  • Identify and act on opportunities to modernize cloud resources.
  • Optimize costs and boost performance.
  • Understand specific modernization areas—such as migrating from GP2 to GP3 volumes or adopting Graviton-based instance.


Modernization opportunities

Help FinOps teams support DevOps to eliminate outdated, inefficient cloud infrastructure

From zero to Run in no time

Hit peak FinOps maturity out of the box. Envisor’s real-time analytics and familiar Power BI /Fabric interface enable unmatched speed to insights, ease of navigation and report customization.

10x insights

Power BI makes Envisor work smarter: fewer clicks, faster answers.

  • View data with hourly granularity.
  • Slice, dice and drill into every report.
  • Understand the why behind KPIs.

  • Produce reports without having to export to Excel.
  • Use the standard reports as-is or easily customize them.
  • Click on any category—e.g. Downsize Recommendations—to instantly see all related metrics in context. 

FOCUS compliance means Envisor flattens the FinOps learning curve and normalizes every cost source.

  • Like-for-like comparison across hyperscalers and SaaS providers.
  • 85+ APIs enrich Envisor’s FOCUS-compliant semantic model.
  • First FOCUS-compliant CCM.
  • First to support Snowflake SaaS billing data.
FOCUS on analytics-1

Built for enterprise performance and visibility

Supported platforms 

Amazon_Web_Services_Logo-2
Azure Logo
Google-Cloud-logo
Snowflake logo-png
Microsoft Fabric
Focus Logo
Copilot Logo