FinOps analytics
See everything. Start anywhere.
Drill into what matters.
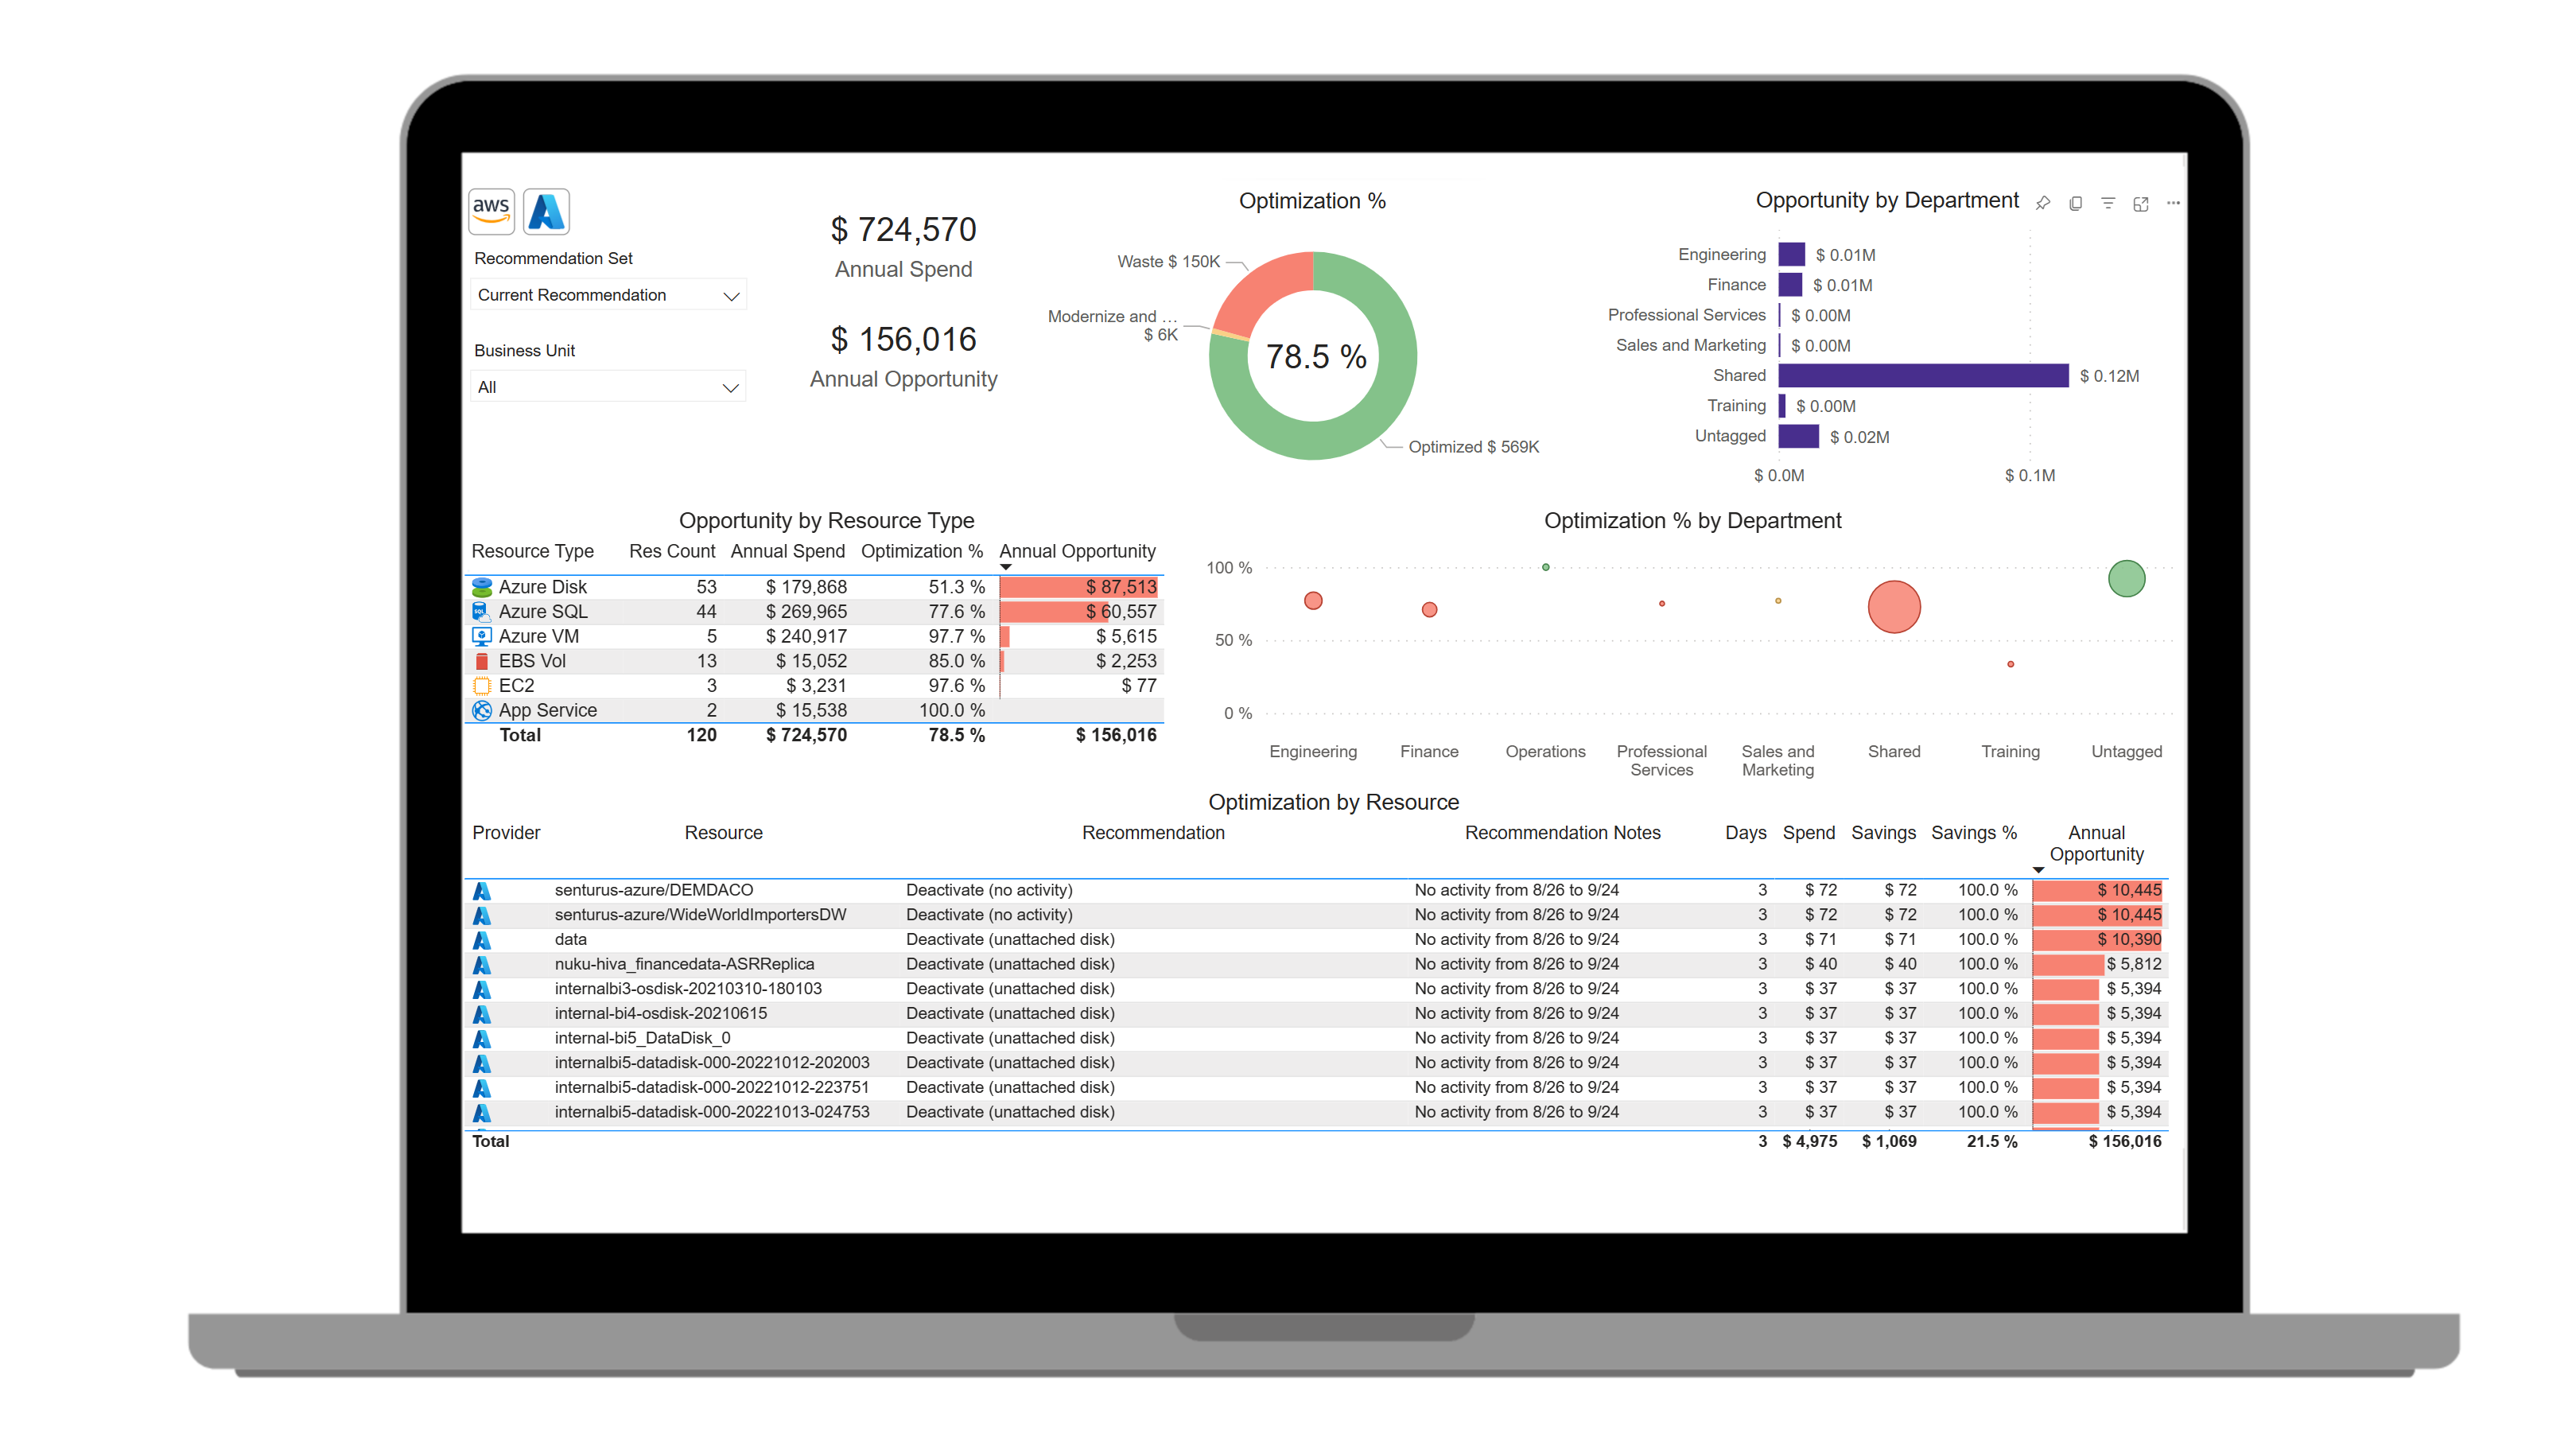
Cloud health clarity starts here
The Envisor Launchpad is your daily command center for managing multi-cloud operations. Organized around key FinOps priorities, it shows real-time cloud status at a glance. One click lets you dive deeper into details.
- CIOs and leadership, quickly assess overall cloud health or risk.
- Finance, Engineering and FinOps teams, drill-through to details to analyze potential issues before they become big problems.
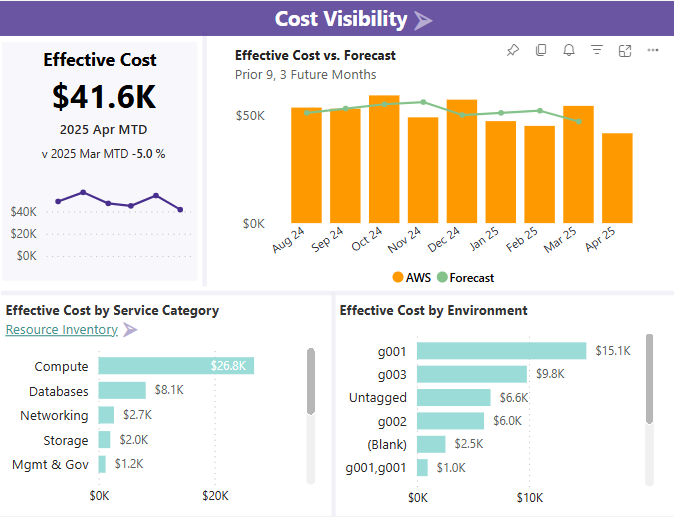
Cost visibility
Get different lenses into what it costs to run your cloud.
- Review historical spend trends.
- Compare budget-to-actuals.
- Break down spend by category, e.g., compute, storage, networking.
- Identify spend by environment or products.
- View by effective or built cost.
- Run prior-period comparisons.
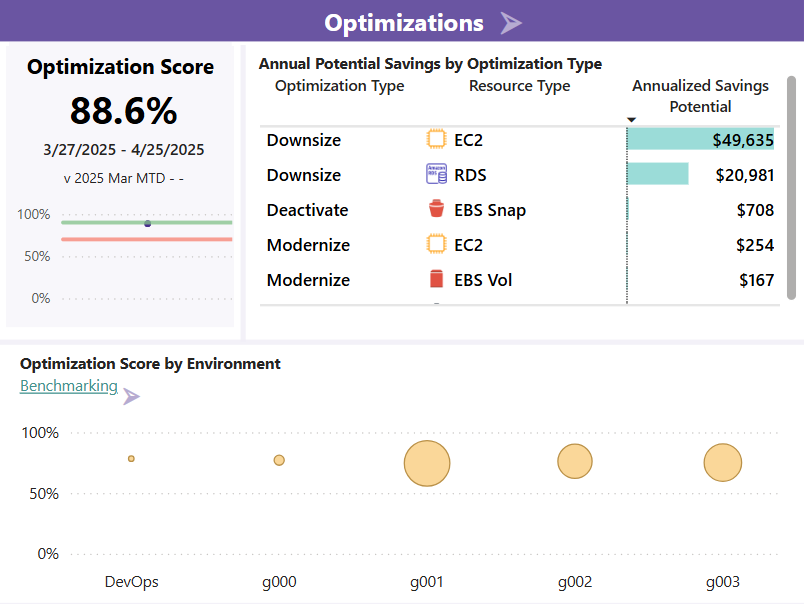
Optimizations
Instantly identify where to focus cost-saving and rightsizing efforts—no spreadsheets, no guesswork.
- Quickly pinpoint areas of waste and inefficiency.
- Track your optimization score over time.
- View prioritized savings opportunities by resource type.
- See how departments stack up and which has the most area for improvement.
- Access recommendations across multiple cloud providers and departments.
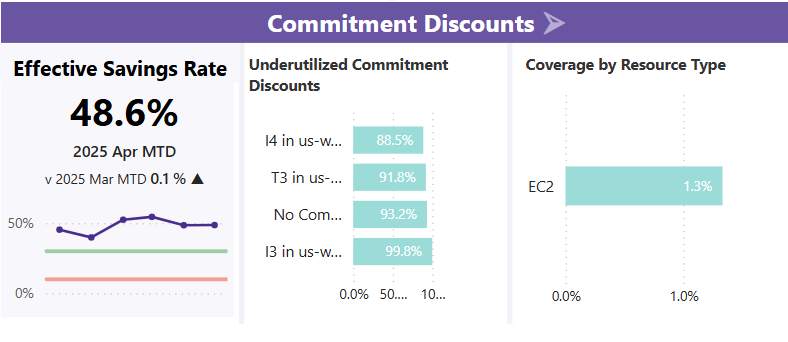
Commitment discounts
Be confident you're getting the most from your cloud providers’ savings programs.
- Get detailed analysis; know if you are maximizing your Savings Plans and Reserved Instances utilization.
- View key metrics for commitment discounts such as Effective Savings Rate, Underutilization, and Coverage Rates.
- Access detailed, data-backed recommendations for optimal commitment purchases.
- Easily present insights to management using clear, actionable visuals.
- Move past vague, black-box suggestions. Make informed decisions. Envisor runs and shows the Monte Carlo simulations behind its recommendations.
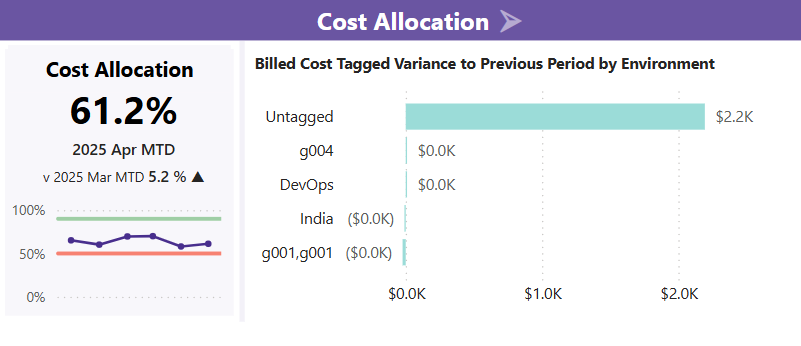
Cost Allocation
Promote cost accountability and track against multiple dimensions.
- Perform chargeback and financial system integration.
- Drive accountability to the edges of your organization.
- Leverage tags to associate usage/cost to individual business units.
- Integrate cloud data into your internal reporting systems and financial management tools.
Rich, drillable reports.
Built for FinOps, customizable for you.
|
Department scorecards Instantly track and elevate FinOps performance across all your teams |
|
|
|
Manage to your cloud budget and forecast with confidence |
|
Quickly drill into variances to find root cause |
|
|
|
Modernization opportunities Help FinOps teams support DevOps to eliminate outdated, inefficient cloud infrastructure |
From zero to RUN in no time
Hit peak FinOps maturity out of the box. Envisor’s real-time analytics and familiar Power BI /Fabric interface enable unmatched speed to insights, ease of navigation and report customization.
Power BI makes Envisor work smarter: fewer clicks, faster answers.
- View data with hourly granularity.
- Slice, dice and drill into every report.
- Understand the why behind KPIs.
- Produce reports without having to export to Excel.
- Use the standard reports as-is or easily customize them.
- Click on any category—e.g. Downsize Recommendations—to instantly see all related metrics in context.
FOCUS compliance means Envisor flattens the FinOps learning curve and normalizes every cost source.
- Like-for-like comparison across hyperscalers and SaaS providers.
- 85+ APIs enrich Envisor’s FOCUS-compliant semantic model.
- First FOCUS-compliant CCM.
- First to support Snowflake SaaS billing data.
Built for enterprise performance and visibility
Supported platforms



.png?width=1800&height=900&name=image%20(16).png)


