
The scalability of the cloud enables businesses to quickly pivot to meet opportunity. But its variable spend model makes constant monitoring of cloud cost and performance a necessity. Without ready access to data, cost overruns and inefficient spending become common place.
The key to efficient management of the cloud is visibility into the many drivers behind utilization and spend. FinOps practitioners need to understand how to allocate costs, right size resources and reservation plans, identify potential savings, and forecast spend. They seek to synthesize cloud cost data with external business data to measure per unit efficiency (aka unit economics).
Equally important to data access is the ability to easily share insights across the organization. Finance, engineering and other business units each have a different but inter-related responsibility as it relates to creating cloud efficiency. Management of the cloud is a collective responsibility; with shared access to reports, cross-functional teams can align more easily on cost and performance decisions.
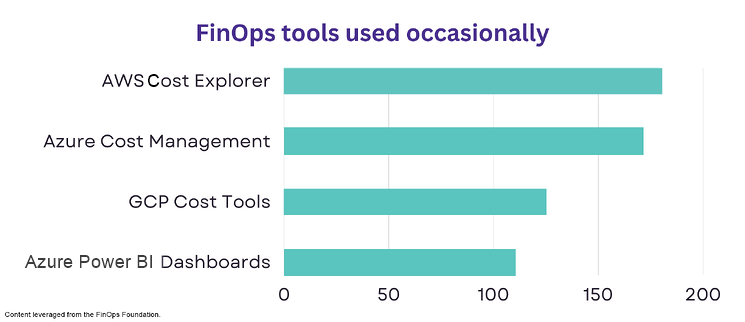
Given these needs, a plethora of cloud cost management tools has come to market. The FinOps Foundation published survey results showing the top tools organizations are using. The top three align with the most popular public cloud providers: AWS, Azure and Google. Not surprising.
But, these cloud-native tools have limitations in their ability to do robust analytics. Among the issues: they only report on data within their respective cloud — not competitors’ clouds — and external business metrics cannot be integrated.
So, what is the most popular tool after the cloud native tools? Power BI.
Power BI has become the de facto tool for rapid analysis and visualization of data. Easy to use, powerful and familiar, Power BI helps organizations dig into their cloud KPIs.
Six reasons we like Power BI for FinOps analytics:
-
No learning curve. Rather than introducing yet another reporting tool into the mix, Power BI is an already-familiar tool for most organizations.
-
Flexibility. Power BI reports can be customized to meet different audience perspectives and objectives. Finance, engineering, C-suite and various departments each have different motivators for what they want to achieve.
-
Extensibility. External data can be incorporated with the cloud metrics for a comprehensive view of cloud impact on the organization. Analytics become more robust, moving beyond simple tracking of cloud spend and usage to creating efficiency metrics, like cloud-cost-per-unit.
-
Consistency, repeatability and accuracy. Using Power BI eliminates the time consuming, multi-step and error prone process of exporting and massaging data in Excel each time the data is refreshed. In Power BI, the data prep and report can be created once and be re-run often for timely insights.
-
Governance/security. Using Power BI introduces a measure of security over the data even when the content is exported to Excel, PDF or another format. This becomes especially important when bringing in sensitive enterprise data. Learn more about Power BI data protection.
-
Easy to share reports. Natively, Power BI has many ways to share reports and dashboards, including embedding and subscriptions. Read more about Power BI distribution options.
Power BI: a great first step
Visibility into cloud usage and cost metrics is the key to controlling cloud spend. As a familiar and mature analytics tool that offers tremendous flexibility, Power BI opens the door to better cost management.
To fully evolve to a highly efficient FinOps practice, however, requires more metrics, faster. Power BI needs to access timely, normalized data across all the cloud vendors and resources in use. Data from other enterprise sources needs to be added to the mix as well. This kind of robust reporting requires a data repository and well-designed data models.
Investing in the data structure to support such agile reporting has significant rewards. It cuts out time spent in data prep and improves reporting accuracy. KPIs are available in a single location, ready for analysis by different groups and with the ability to drill into details to answer why. Cost overruns can be spotted and dealt with before they become a problem. Responsive reporting gives organizations the agility they need to manage the cloud with efficiency, leveraging its value rather than responding after the fact to high bills.
If you are looking to better analyze and understand your cloud spend, Power BI offers a good starting point. However, to really evolve your organization’s FinOps journey, you’ll need to build out the backend.
Better yet, get in touch with us and let us tell you about Envisor.
Purpose-built for FinOps reporting, Envisor marries the intuitive ease of a Power BI dashboard interface with an extensible data warehouse and real-time operational data. Quickly deployed, it delivers normalized cloud KPIs from multiple cloud vendors out of the box so you skip the data prep and immediately get to actionable insights.